

Chicago’s 2026 homicide count increased from 313 to 314 between the Sept. 19 and Sept. 21 dashboard snapshots, yet the displayed year-over-year decline grew from 0.3% to 1.9% because the 2025 comparison count jumped from 314 to 320.
Fatal shootings also increased from 278 to 279, while the displayed increase fell from 8.2% to 6.9%. The raw counts rose while the rolling percentages moved in a more favorable direction.
Crime Report Sept. 24, 2026
CHICAGO — Percentage says improvement. Raw 2026 homicide count does not.
Chicago’s Violence Reduction Dashboard presents a statistical contradiction that disappears only when the percentages are stripped away and the underlying counts are compared.
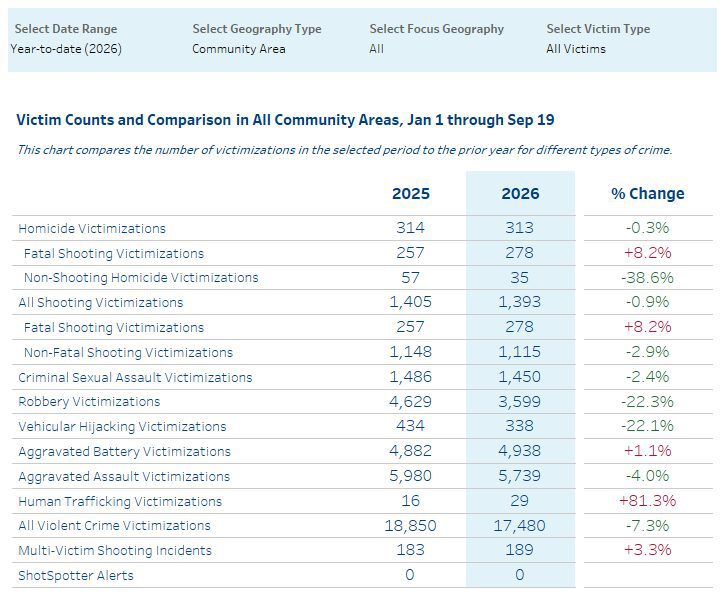
Through Sept. 19, Chicago recorded 313 homicide victimizations compared with 314 in 2025, putting the city one homicide below last year, or 0.3% lower.
Two dashboard days later, Chicago’s 2026 homicide count had increased to 314.
Yet the City’s year-over-year percentage looked better.
Through Sept. 21, the dashboard showed 314 homicides compared with 320 in 2025, putting Chicago 1.9% below last year.
Chicago added a homicide.
The percentage showed greater improvement.
Both statements are true.
How a Rising Homicide Count Produces a Better Percentage
The explanation is buried in the comparison.
Between the Sept. 19 and Sept. 21 snapshots:
2026 homicides increased 313 → 314
2025 comparison homicides increased 314 → 320
Six additional homicides entered the corresponding 2025 comparison period while one entered the 2026 count.
That changed the displayed comparison from:
Sept. 19
313 vs 314
-0.3%
to:
Sept. 21
314 vs 320
-1.9%
No previously counted 2026 homicide had to disappear for the percentage to improve.
Instead, the current-year count rose, while the prior-year benchmark rose faster.
The arithmetic is mathematically consistent. But reporting only the percentage obscures what happened underneath it.
A reader told that homicides went from 0.3% below last year to 1.9% below last year could reasonably conclude that Chicago’s current homicide count improved between those snapshots.
It did not.
The count increased.
Fatal Shootings Tell the Same Story
Fatal shooting victimizations provide an even sharper example.
Through Sept. 19:
2026 278
2025 257
+8.2%
Through Sept. 21:
2026 279
2025 261
+6.9%
Chicago added another fatal shooting victim.
Yet the reported year-over-year increase fell from 8.2% to 6.9%.
Again, the explanation comes from the comparison year.
The 2026 fatal-shooting count increased by one, from 278 to 279.
The corresponding 2025 count increased by four, from 257 to 261.
The percentage therefore moved in a more favorable direction even while the current-year fatal-shooting count increased.
Through Sept. 21, Chicago has recorded 279 fatal shooting victimizations compared with 261 last year — 18 more people killed by gunfire, an increase of 6.9%.
Six Fewer Homicides Overall … 18 More Killed by Gunfire
The underlying numbers reveal another split obscured by the overall homicide percentage.
Chicago has:
314 homicide victims in 2026
320 homicide victims in 2025
That is six fewer overall.
But fatal shootings stand at:
279 in 2026
261 in 2025
That is 18 more people killed by gunfire.
How can Chicago have six fewer homicides while having 18 more fatal shootings?
Non-shooting homicides explain most of it.
Those dropped from 59 in 2025 to 35 in 2026, a decline of 24 victims or 40.7%.
The decline in non-shooting homicides is large enough to offset the increase in fatal shootings when both are rolled into the overall homicide total.
The overall homicide percentage therefore says down 1.9%.
Fatal shootings say up 6.9%.
Both come from the same dashboard.
Aggravated Batteries Also Higher
Fatal shootings are not the only violence measure running above last year.
Aggravated battery victimizations increased from 4,928 to 4,974, an increase of 46 victims or 0.9%.
Multi-victim shooting incidents increased from 188 to 191, up 1.6%.
Those increases exist alongside declines in several other categories.
All shooting victimizations stand at 1,404 compared with 1,424, down 1.4%.
Nonfatal shooting victimizations stand at 1,125 compared with 1,163, down 3.3%.
Overall violent-crime victimizations stand at 17,621 compared with 18,996, down 7.2%.
The numbers therefore do not support saying all violence is increasing.
They do show something more specific:
Fatal shootings are higher. Aggravated battery victimizations are higher. Multi-victim shooting incidents are higher.
At the same time, the City’s headline homicide percentage is lower.
The Percentage Is Accurate … But It Is Not the Whole Story
There is no mathematical error required to produce these results.
Year-to-date comparisons use a moving benchmark.
Every new calendar date adds cases from 2026 and the corresponding dates from 2025.
If the 2025 side accumulates cases faster over a particular period, the 2026 year-over-year percentage can improve even while the actual 2026 count rises.
The reverse can happen when 2026 accumulates cases faster.
The problem comes when a percentage is treated as though it describes whether the current count itself went up or down.
It does not.
Between these two snapshots, Chicago did not reduce its 2026 homicide count from 313. It increased it to 314.
Yet the displayed comparison moved from 0.3% below last year to 1.9% below because the 2025 benchmark jumped by six.
Fatal shootings behaved the same way.
The current count increased from 278 to 279, while the percentage increase declined from 8.2% to 6.9% because four additional fatal shootings entered the corresponding 2025 benchmark.
The percentage improved. The raw 2026 counts increased.
That distinction disappears when only the percentage is reported.
CPD’s Separate Report Shows Another Layer
Chicago Police Department’s Week 38 Public Safety Report provides a separate measure of crime and should not be confused with the Violence Reduction Dashboard.
The CPD report covers Sept. 14 through Sept. 20 and records 313 murders compared with 316 at the same point in 2025, down 1% year to date.
Shooting incidents stand at 1,079 compared with 1,119, down 4% year to date.
But the latest seven-day period moved in the opposite direction.
CPD recorded 34 shooting incidents compared with 30 during the comparable week last year — up 13%.
Motor vehicle theft increased as well.
The latest seven days recorded 338 motor vehicle thefts compared with 304, up 11%, while the year-to-date count reached 13,205 compared with 12,179, up 8%.
CPD’s Public Safety Report counts crime complaints and shooting incidents. The Violence Reduction Dashboard contains victimization measures. They are different statistical products and should not be blended as though they count the same thing.
Sept. 21 Dashboard
Homicides 314 vs 320 -1.9%
Fatal shootings 279 vs 261 +6.9%
Non-shooting homicides 35 vs 59 -40.7%
All shooting victims 1404 vs 1424 -1.4%
Nonfatal shooting victims 1125 vs 1163 -3.3%
Aggravated batteries 4974 vs 4928 +0.9%
Multi-victim shootings 191 vs 188 +1.6%
All violent crime 17621 vs 18996 -7.2%
What the Numbers Actually Say
Chicago’s official statistics do not show one simple crime trend.
Through Sept. 21:
18 more people have been killed by gunfire than at the same point last year.
46 more aggravated battery victimizations have been recorded.
Three more multi-victim shooting incidents have been recorded.
Chicago simultaneously has six fewer homicide victims overall, primarily because non-shooting homicides are substantially lower.
And between Sept. 19 and Sept. 21, the City’s homicide percentage became more favorable while the actual 2026 homicide count increased.
Calling the calculation false would not be supported by the numbers.
Calling the percentage the complete story would not be supported by them either.
The percentage says Chicago moved further below last year.
The raw count says Chicago added another homicide.
Understanding both requires looking past the percentage and reading the numbers underneath it.
Crime Confidence Index™ asks not only how much crime is occurring, but … how much confidence the public can place in the numbers used to describe it.
A statistic can be mathematically correct while still giving an incomplete picture when presented without its underlying counts. Between the Sept. 19 and Sept. 21 dashboard snapshots, Chicago’s 2026 homicide count increased from 313 to 314, while the displayed year-over-year decline improved from 0.3% to 1.9% because the corresponding 2025 count increased from 314 to 320.
Fatal shootings demonstrate the same problem. The 2026 count increased from 278 to 279, while the displayed increase fell from 8.2% to 6.9% as the 2025 comparison increased from 257 to 261.
The Crime Confidence Index™ examines those differences: the raw counts, changing comparison periods, revisions, classifications and consistency between official crime-data products.
The question is not simply whether the percentage is mathematically correct. The question is whether the statistic, as presented, accurately communicates what is happening on Chicago’s streets.
Sources: City of Chicago Violence Reduction Dashboard | Chicago Police Department Week 38 Public Safety Report | SubX.News® comparison of Sept. 19 and Sept. 21 dashboard snapshots
Public Safety Report Week 38
